

Insight
Market footprint: pair coverage by category
Pair count alone does not tell you whether you are retreating from a segment or missing directions competitors already quote.
7-day full access after verification. No payment required to start.
Overview
Listing four hundred pairs does not say you cover ninety percent of active crypto directions or that cash pairs are shrinking. Market footprint measures your share of active pairs within each currency group and tracks that share over time. You will see which segment to expand next, instead of treating pair count as a proxy for market presence.
How coverage is measured
Conceptual steps below. Full formulas live in the in-app knowledge base after you sign up.
Step 1
Share of active pairs
For each currency group we compare the pairs you quote to all active pairs in that group on the snapshot. The result is a percentage, not an absolute count from your listing page.
Step 2
Latest day and trend
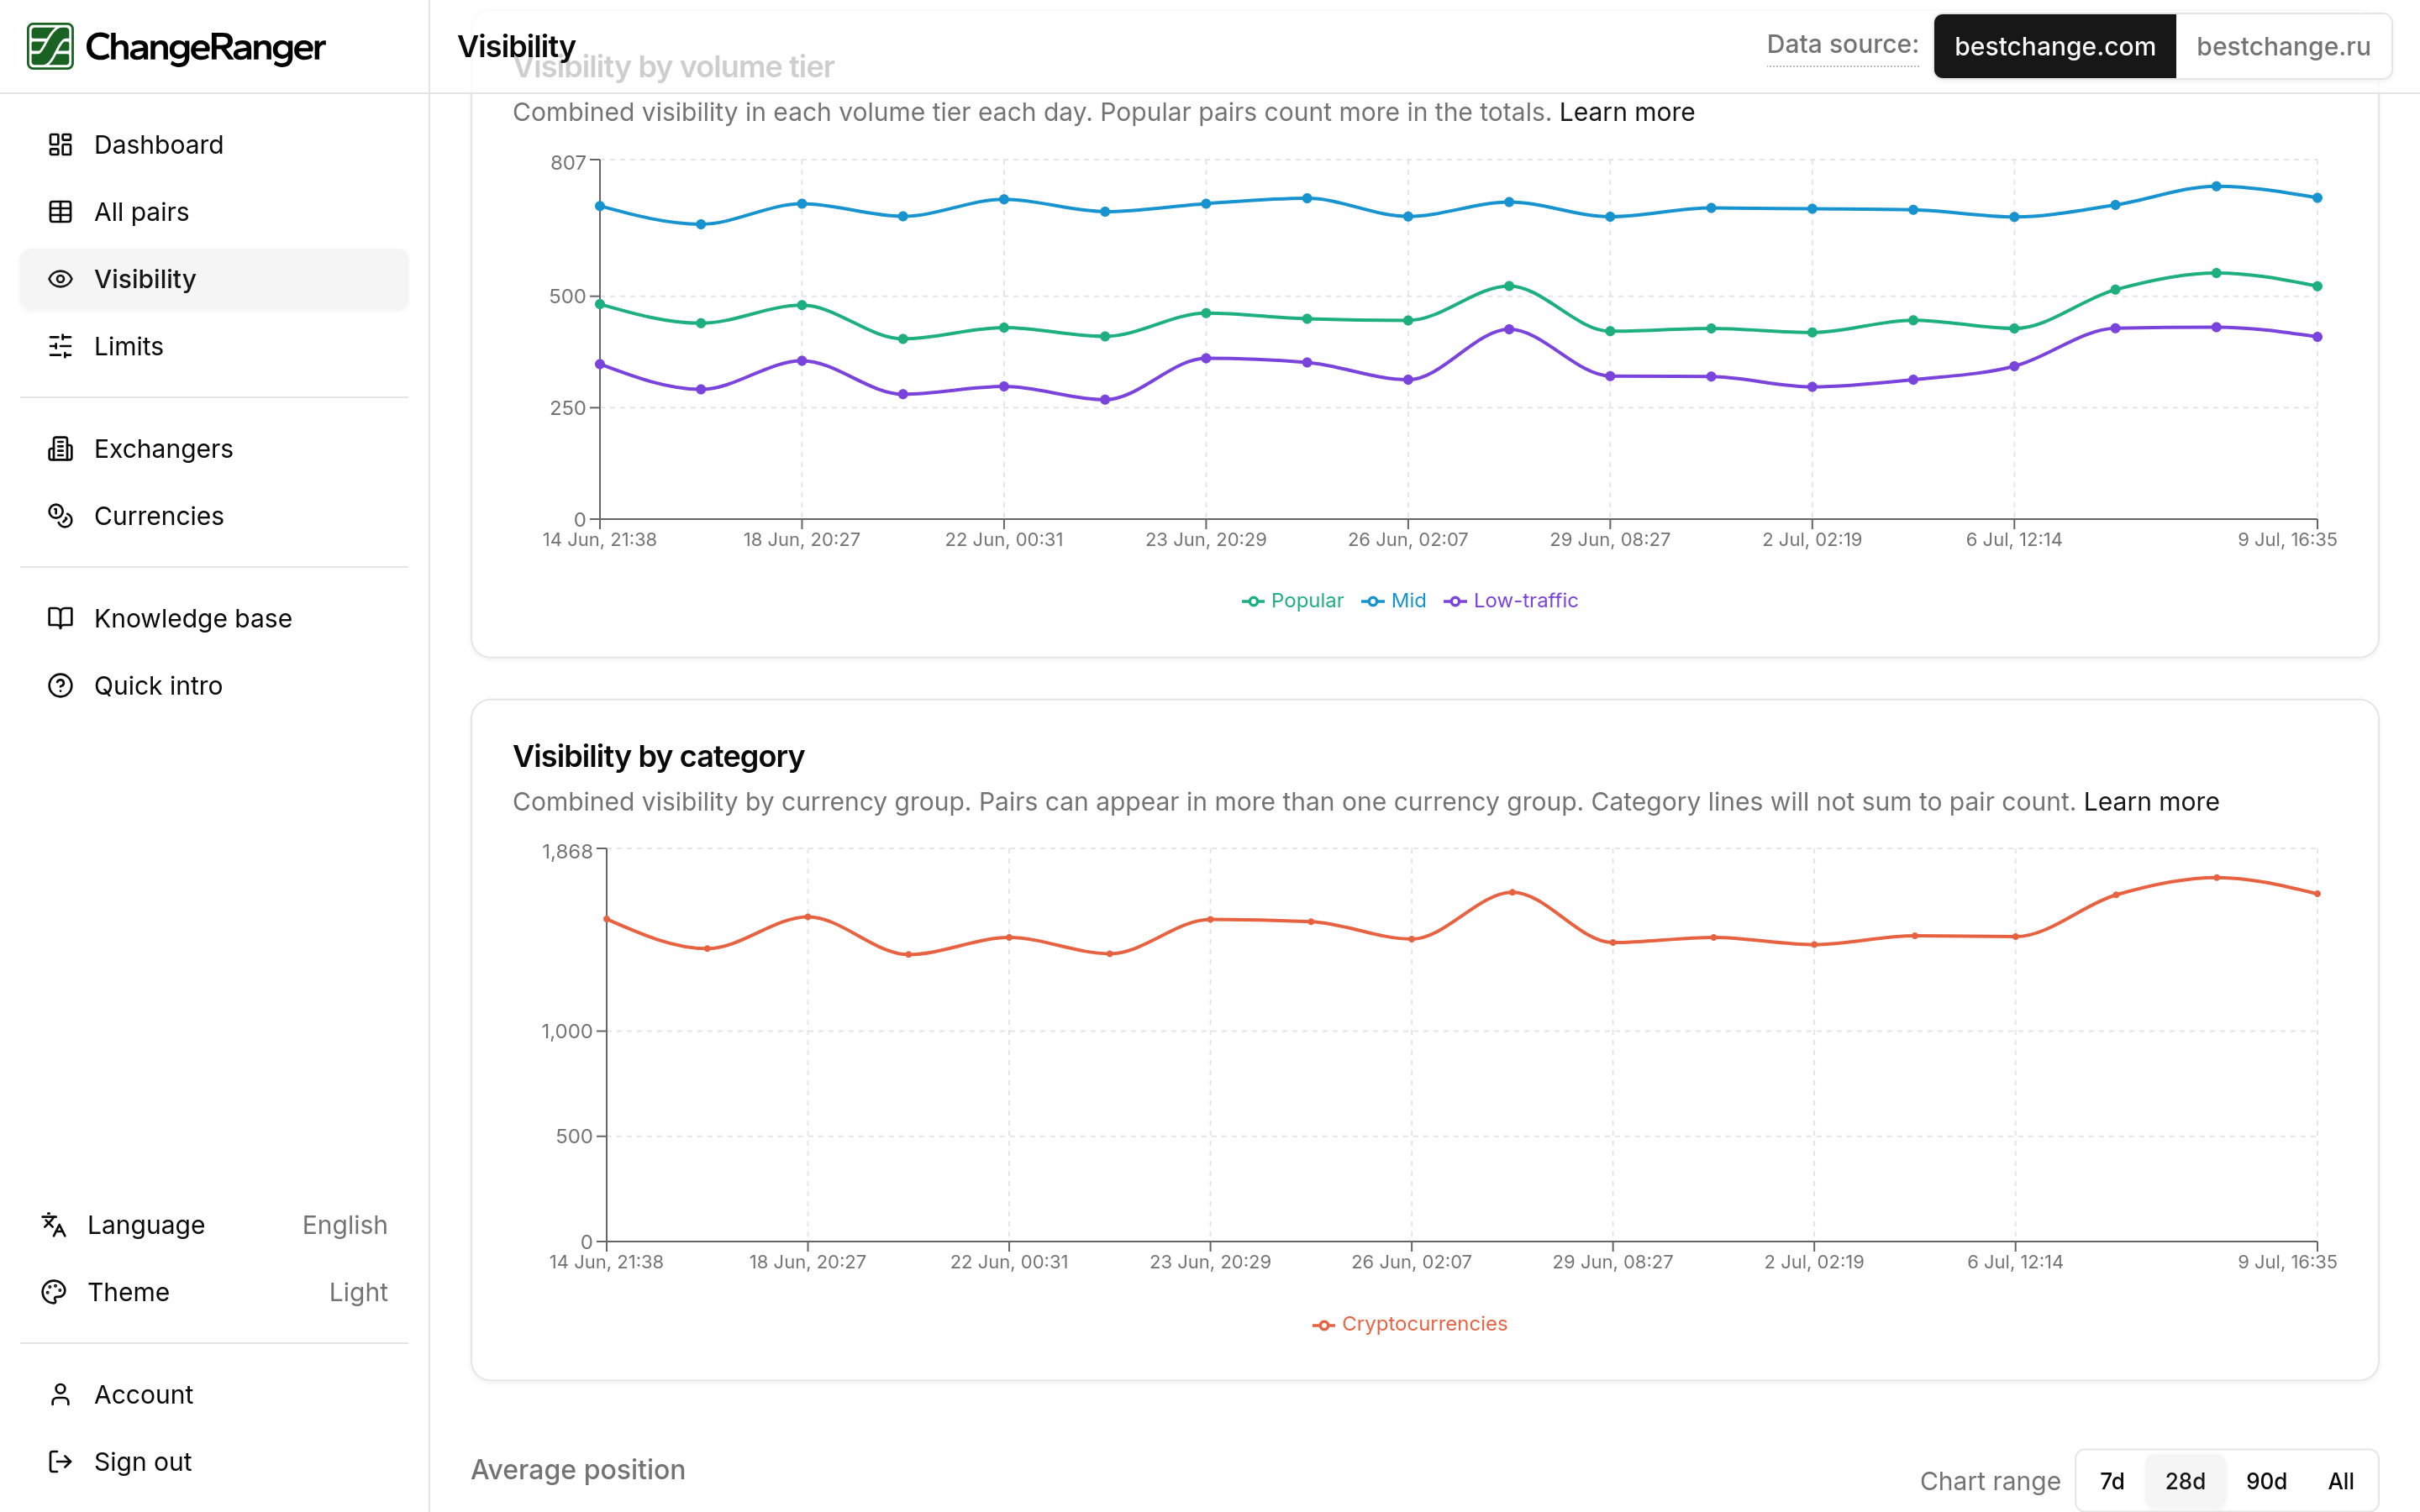
A bar read for today plus a time series for the group, so you see expansion or retreat over weeks rather than a one-off audit.
Step 3
Segment gaps
A low share in one group while competitors quote broadly there is a concrete signal for listing priorities, separate from how you rank on pairs you already offer.
Coverage definitions and category groupings are documented in the in-app knowledge base.
What you'll see in ChangeRanger
Dashboard
Coverage by currency group over time.
Visibility page
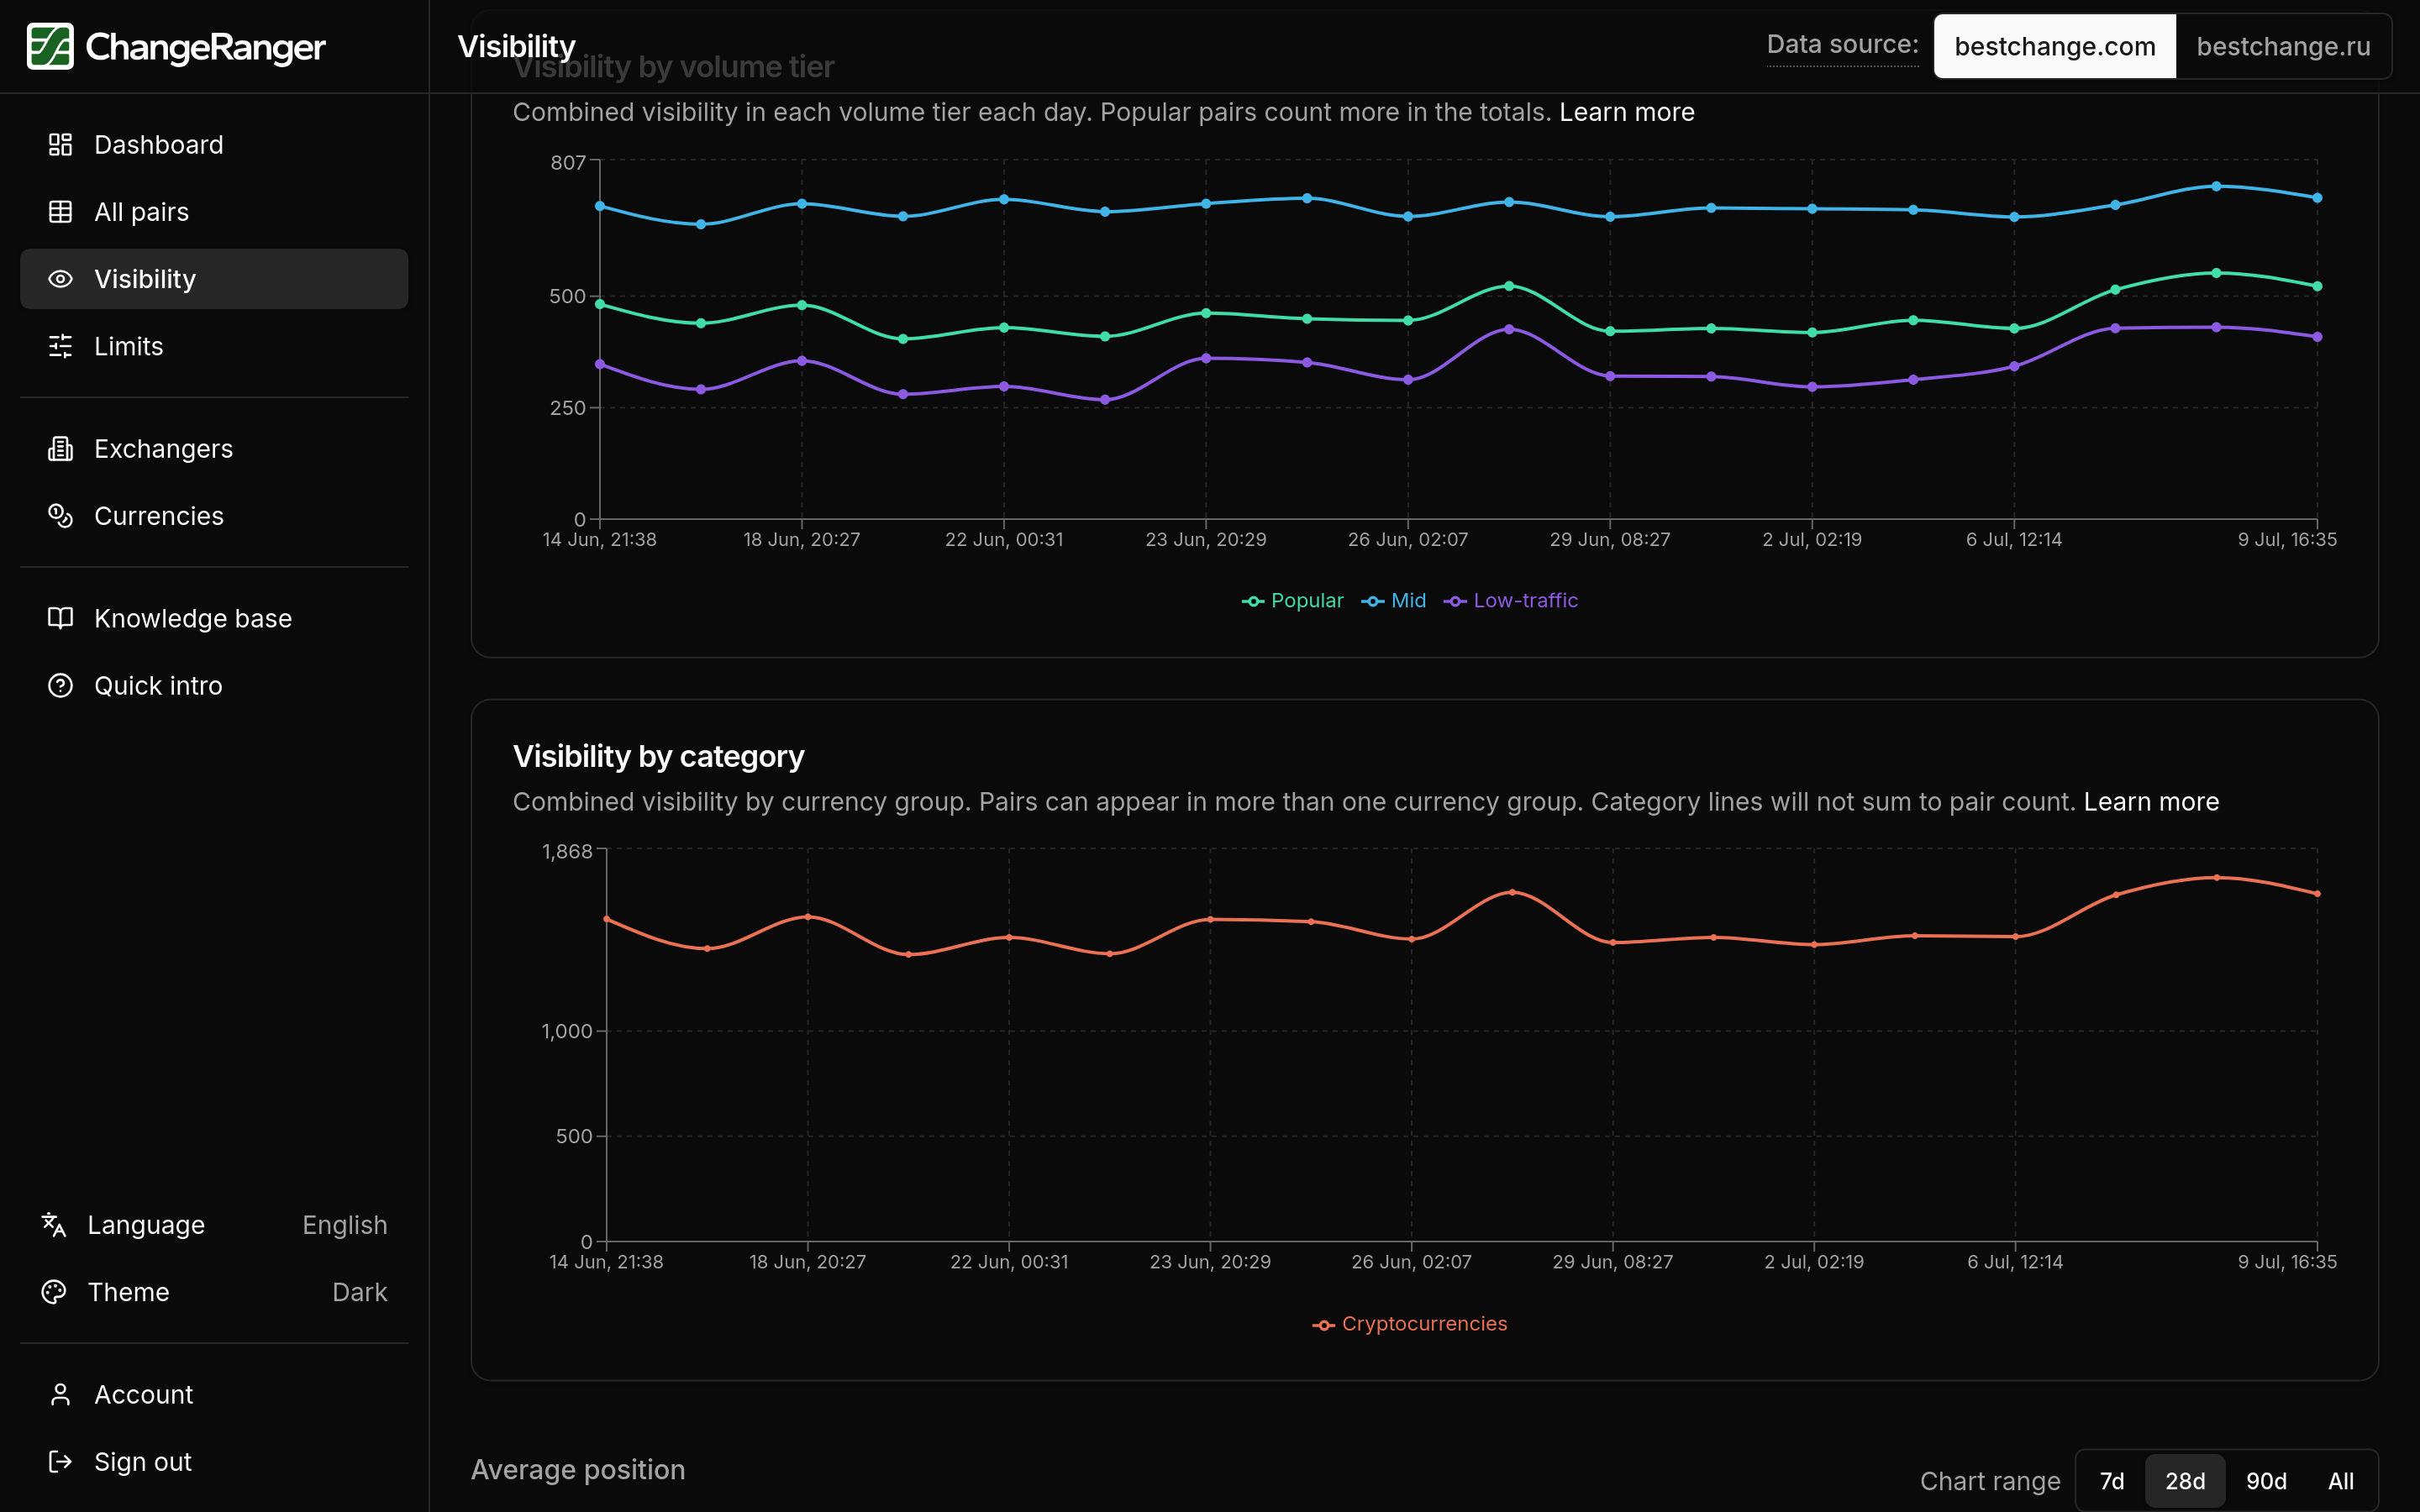
Category splits beside footprint context.
Currencies reference
Browse groups when planning expansion.
Related insights
These core metrics build on the same daily snapshots. Explore how they connect.
Trends
Why did our performance dip last week?
Open dashboard charts for the exchanger-wide move, narrow to the pairs or metrics that shifted, then use pair detail to compare snapshots from the dip window to the week before and see when rank, limits, or coverage changed.
Read moreVolume tiers
Are we winning on popular pairs or only on low-traffic ones?
Start weekly reviews with Popular-tier visibility and limits, check whether a dip is isolated to one tier before adjusting rates across the board, and filter the all-pairs table to popular directions when you plan promotions.
Read moreTry market footprint on your exchanger
7-day full access after verification. See coverage share by currency group and how it trends on your listing.